With Google Core Web Vitals being a ranking factor, it’s important to run speed tests on your website regularly to ensure you’re meeting all the thresholds. You want every advantage you can get in search engine result pages (SERPs). Unfortunately, there are times when you might get errors with these tools.

Today I’m going to walk you through troubleshooting the “Lighthouse returned error: NO_FCP” message in PageSpeed Insights.
How to fix the Lighthouse returned error: NO_FCP
First, I’m going to walk you through a couple of different variations of how the error might appear depending on the tool you’re using.
Error when using PageSpeed Insights
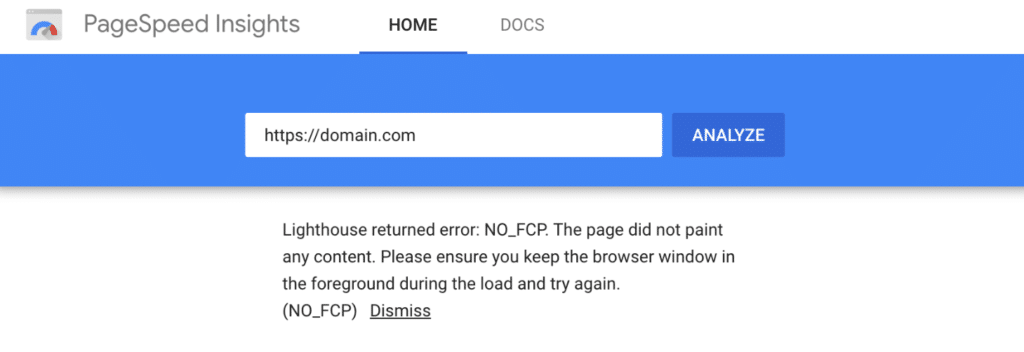
PageSpeed Insights is powered by Google Lighthouse. It has a 15-second timeout associated with it. So if your page doesn’t load or respond within 15 seconds, it will result in a NO_FCP error. It will show up as the following:
Lighthouse returned error: NO_FCP. The page did not paint any content. Please ensure you keep the browser window in the foreground during the load and try again. (NO_FCP)

Error when using web.dev
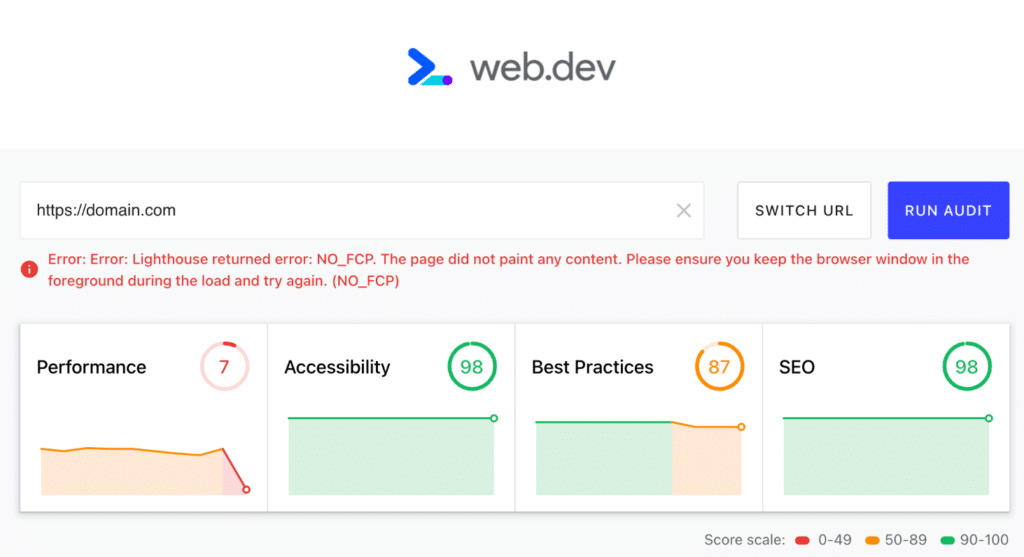
If you’re using the web.dev measure tool, the error will show up as the following:
Error: Lighthouse returned error: NO_FCP. The page did not paint any content. Please ensure you keep the browser window in the foreground during the load and try again (NO_FCP).

Error when using GTmetrix
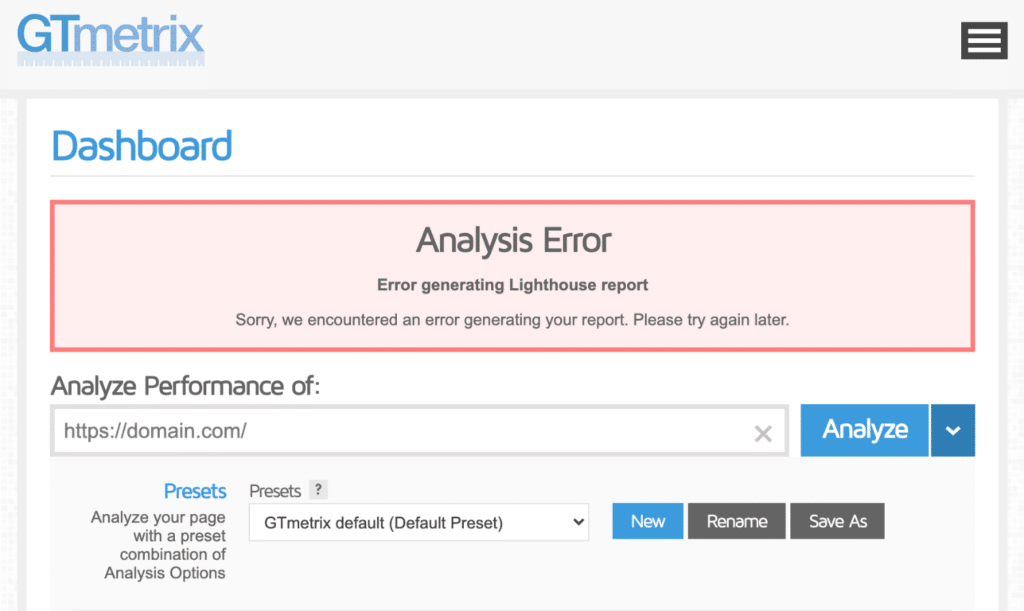
If you’re using GTmetrix, the error will show up as the following:
Analysis Error: Error generating Lighthouse report: Sorry we encountered an error generating your report. Please try again later.

Troubleshooting steps
I’ve seen the above errors happen many times on client sites when running speed tests. Unfortunately, the error itself isn’t very beneficial as it’s just telling you that the test wasn’t able to even run successfully. Below I’ll walk you through some common troubleshooting steps you can do to fix them.
- Try incognito mode
- Check caching
- Slow hosting
- Temporarily disable plugins and theme
- Opacity, animations, fade-in
Try incognito mode
The first thing to do is try running the speed test again in incognito mode. It could very well be that you simply need to clear your cache/cookies or have a browser extension that is interfering with the test.
Check caching
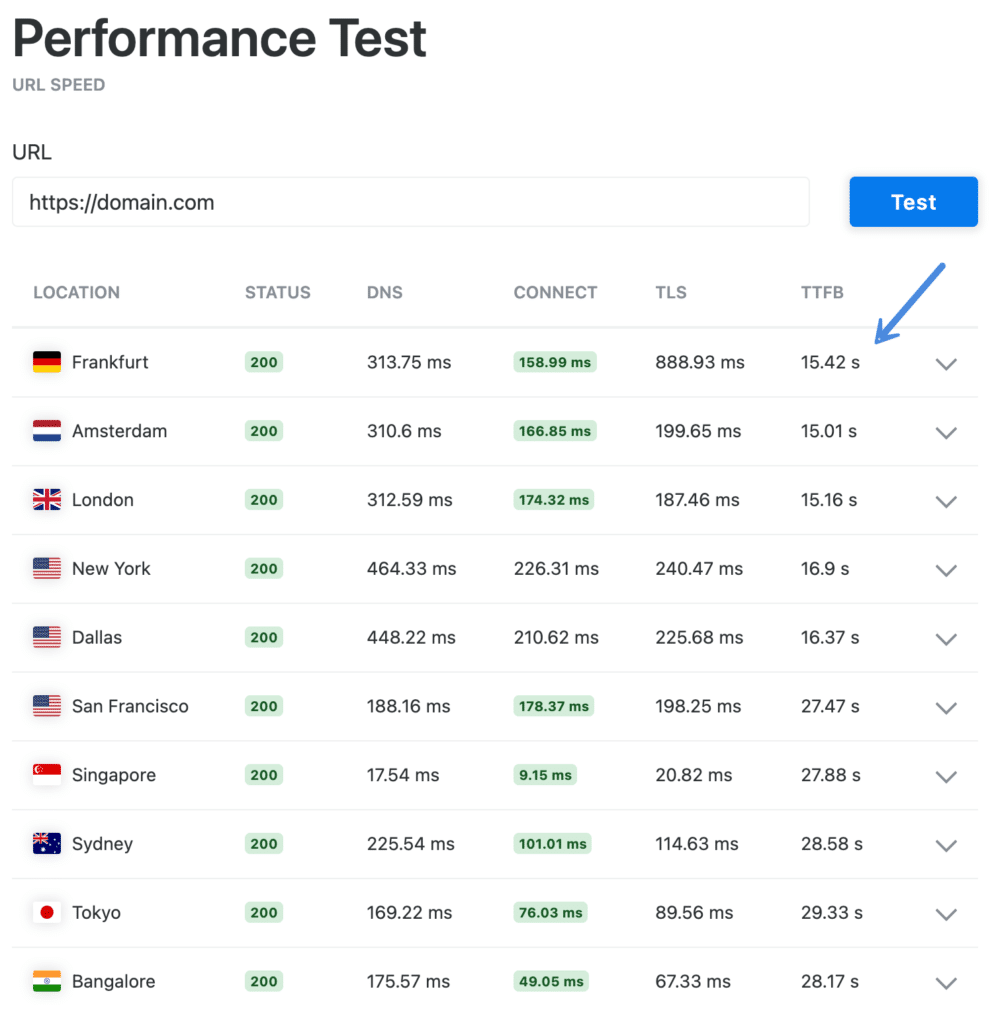
Check to make sure caching is properly configured on your WordPress site. If you don’t have caching implemented, this can create long wait times and high time-to-first-byte (TTFB) numbers. This is very common. A quick way to test your TTFB is using the Performance Test tool from KeyCDN.

Fast TTFB is under 100 ms, and anything in the 100 ms to 300 ms range is relatively normal. However, if your TTFB is higher than 1,000 ms (1 second), then you most likely have a problem. In the screenshot above, you can see there is a huge issue that needs to be resolved. Remember, Google Lighthouse has a 15-second timeout.
If you have server-level caching, check with your hosting provider to see why it’s not working. If you have a caching plugin, make sure it’s activated and set up properly. See more recommendations on how to configure cache in WordPress.
Slow hosting
If you’re getting one of the errors above, it could be due to a slow or cheap hosting provider. The term “you get what you pay for” comes into play here. If it’s shared hosting, it could very well be that it’s low on resources and is struggling to perform.
Users almost always undervalue the impact that a hosting provider plays on the overall speed of a WordPress site. Therefore, I always recommend choosing a high-performance and quality hosting provider, such as Kinsta or SiteGround. We use Kinsta for hosting all of our sites.
Read more about recommendations for WordPress hosting.
Temporarily disable plugins and theme
One of your WordPress plugins, or a third-party call associated with one, could be causing a timeout. I recommend temporarily disabling all of your WordPress plugins and then running another speed test. If that fixes the issue, you can re-enable your plugins one by one, testing as you go, until you find the plugin causing it.
The same goes for your WordPress theme. You can temporarily switch your theme back to one of the default themes in WordPress (Twenty Twenty-One) to see if it fixes the issue.
Opacity, animations, fade-in
Some users in the comments have also experienced this issue when dealing with things like opacity, animations, and fade-ins. If you have a theme or plugin adding one of these effects, check to see if they have an option to turn it off. Make sure to also check any custom code you’ve added.
Summary
Hopefully one of the above recommendations helps you resolve the “Lighthouse returned error: NO_FCP” message. Caching, slow hosting providers, and plugins/themes are almost always the culprits. If you have any other tips that you think I missed, drop them below in the comments.
There is another reason this can occur, as Lighthouse appears to sometimes not consider any element which begins life at opacity: 0, even if that beginning-of life is via an animation. In my case the body tag was set to opacity:0, and transitioned on page load to opacity:1. When this occurred, Lighthouse could not detect any content, and gave the same error message as above. Removing the transition and setting opacity to 1 fixed this.
Hi Chris,
Exact same issue was with me. Later I read your comment and understood that because of my page “fade-in” animation GTmetrix was getting white flash 😂😂😂😂😂. So after removing the entrance animation GTmetrix got eyes.
Hi Chris.
Thanks very much for your notes on Opacity. For whatever reason, my site began getting this major “NO_FCP” issue on the performance metrics via PSI. In checking the many things on this list, I happened to check and discovered that my theme’s site body opacity was set at “0”. I only caught it because I often retain default settings for such theme properties. Also, I was checking because of your comment. So, while scrolling through property settings, I had noticed a null symbol showing, instead of the default icon showing the “color” as defaulted. After I reset it to its default of “1”, I cleared my site’s cache, and everything returned to perfect recognition. THANKS Again!!!